Indicators
Probability Power Elastic Bands
The Probability Power Elastic Bands indicator was originally designed to do two things:
- identify times when the stock has moved too far away from the mean and was posed snap back.
- identify times when the market was overly calm and gathering energy to make a move toward an Institutional Zone
The yellow reversion mean shows when a move is about to happen either in the Power Cloud or a price reversal. Always watch the other Probability Power Indicators for more synergy and to stack probabilities.
Power Elastic Band Strategies
Reversion to Mean
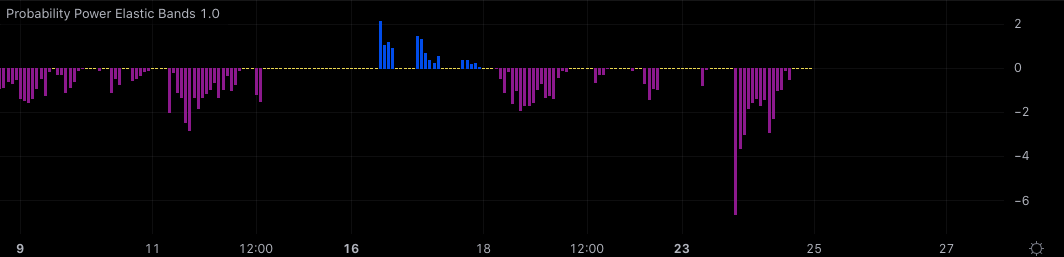
Stocks typically don't trade in a straight line from Point A to Point B. Instead they take a zig zag path around a central point or mean - yellow flat line on the indicator - which varies depending on the direction and movement of the stock.
The Probability Power Elastic Bands helps visualize the distance between the price and the mean and identifies areas where the relative distance for a particular bar is extreme in comparison to the surrounding bars.
Because the indicators values are scaled or normalized, the indicator values have limited usage when compared to other stock's Power Elastic Band indicator values. One should also pay attention to the indicator value scale, as what may look like a significant extreme value may be just a few tenths of a indicator value and not worthy of attention. In these situations, the yellow zero line may appear to be larger than normal, and the indicator value axis will contain all zeros.
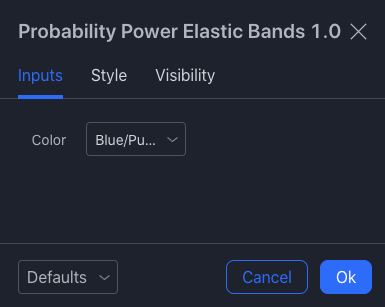
The Probability Power Elastic Bands have their own Indicator Color Settings and will change to the value selected by user.
Calm before the Storm
When a series is normalized or scaled, there is usually a 1 to 1 relationship between each series value and the resulting normalized value.
The Power Elastic Bands Indicator does not use the traditional normalization/scaling. Instead, we 'remove' the normal variations around the mean so that the indicator focuses on and shows just the extreme values.
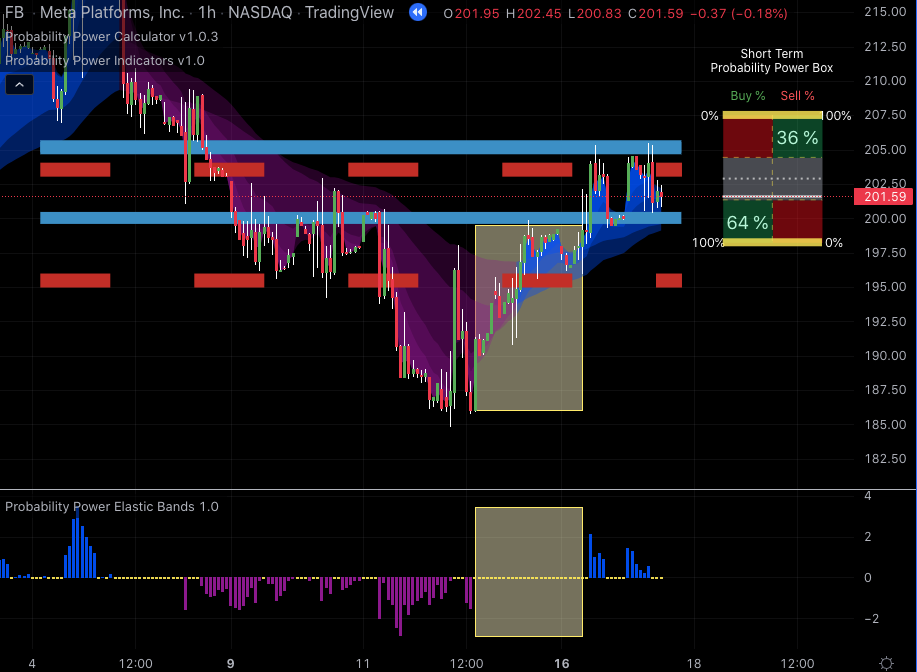
By doing this, we create *periods where there appears to be no values on the chart - representing periods of calm or reduced volatility, and a ** possible beginnings of a reversal or the resumption of the trend within the Power Probability Cloud edges. These calm periods typically precede moves of extreme volatility with longer calm periods resulting in sharper moves.
Divergences
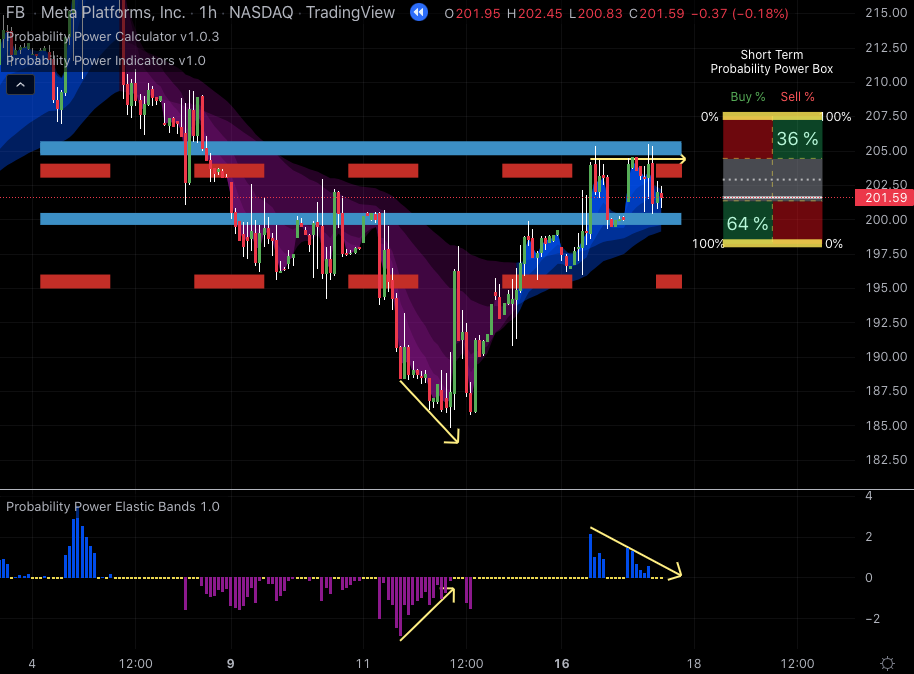
Because the Power Elastic Bands focus on the extreme values, you can often use them to spot divergences between the extreme values and the price. In the image below, there are two divergences - one where the price is making a lower low, and the Power Elastic Bands not making a new lower extreme value, and the second where the price remains at approximately the same level, but the Elastic Bands is making lower highs. Use divergences like this to prepare to make a trade when confirmed by other indicators.
One more thing
One should never rely solely on one indicator but look for a combination of indicators - leading, lagging, trend following, and support/resistance zones before making any trading decision.
Settings
The Power Elastic Bands only has one setting – which Probability Power Indicators™ Color Scheme to use to draw the indicator.