Indicators
Power Volume Indicator
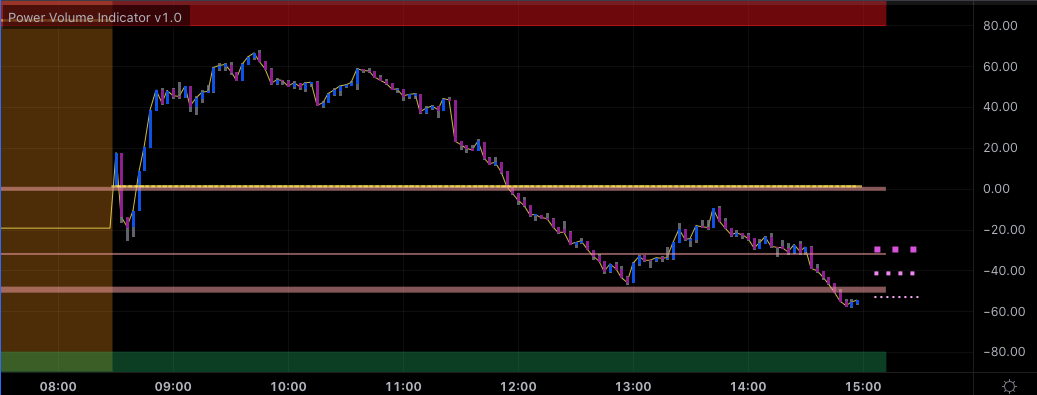
The Power Volume indicator is a broad-based US market directional indicator that measures the buying and selling pressure in the market on short term basis. It is normally use by day traders on less than 60-minute timeframes. You essentially getting a proprietary algo with its own extreme bands and support and resistance ladders that shows NET BUYERS AND NET SELLERS in the SPY, ES, NQ and QQQ indexes.
It is normally use by day traders on less than 60-minute timeframes.
It can, however, be used by swing traders to time their entries or exits from the broad market on longer timeframes once the indicator has reached the extreme band edges of its range — 75 to 120 and -80 to -120 — which normally indicates a market reversal is immediate.
It should be noted, however, that the suitability of the indicator for swing trading, depends upon the current nature of the market. As of this writing (May 2022), the US stock market is undergoing severe market swings from one extreme to the other, and the indicator has reached the opposite edges of its range in less than 24 hours. Thus, one must take into consideration the mood aka the main and intermediate trends with Power Cloud and the Probability Power Calculator before relying solely upon this indicator for swing trading the extremes.
It works well for repositioning yourself in the main market trends on monthly and weekly charts support and resistance, Power Institutional Zones, and Major Power Zones.
The Power Volume Indicator is most useful in gauging the market's potential for a directional shift after the initial opening order surge around 10:00-11:00am ET. Marc's founder teachings are to respect the direction of the indicators after the first 5 minute of the open aka second bar on the indicators show if the market as true power or fuel to go up or anticipate where the prices will be.
USE THE TRADING VIEW replay function it is amazing you will see around the open yellow line the indicators precede price action 80% of the time thus giving the SPY, ES, NQ, and QQQ traders an edge without false promises. Seeing is believing. Use the replay function as far back as you can.
These technical analysis and formations of the indicator are discussed in our Discord or Monthly live events.
Limitations
Due to the way the indicator is calculated, be careful of the first 5-minute gap. The initial 5 minutes after the market opens may not accurately reflect the market's direction due to individual stock opening delays. Wait for the second pressure box on to show itself ideally 3 pressure box continuation with HH Lows or HH Highs or vice versa for a more solid confirmation.
The indicator does not work outside of regular trading hours (9:30am - 4:00pm ET). When extended hours are displayed, the indicator continues to plot the last calculated value of regular trading hours overnight.
The Power Volume Indicator does not work on International Markets such as DAX, LSE or the NSE (India), as it relies on specific US Market data, that is not available for the international markets. We have requested that the data be made available for international markets, but are dependent upon Trading View for this data.
The indicator will not be displayed on non-intraday timeframes.
Indicator Composition
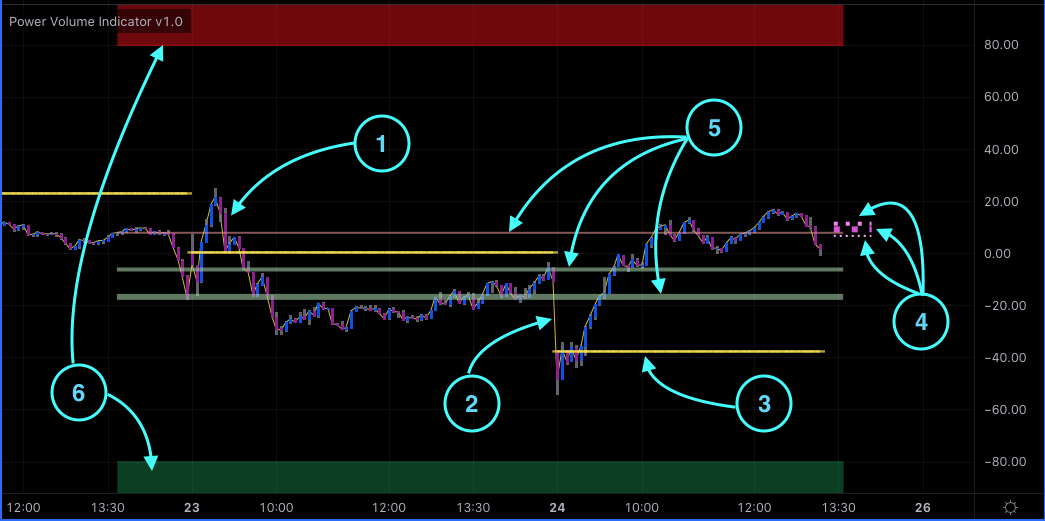
The Power Volume indicator is made up of 6 separate parts:
- The Net Buyer/Seller Pressure Boxes - the Pressure Boxes (they look like candles but are not candles) the green/blue (depending on your setting for color schemes of the indicator itself - see settings) represent times when the buyers are in control, red/purple candles represent times when sellers are in control, and the gray area representing areas that are neutral – where neither the buyers or the sellers were in control.
- The Close Line - a thin yellow line that connects the closes of the net buyer/seller Pressure Boxes - they are not candles.
- The Daily Opening Level - represented by a straight horizontal yellow dashed line.
- The Retracements Segments - three (3) dashed line segments of progressively thicker widths to the right of the current net buyer/seller candle. The thicker the segment, the longer the length of time for the retracement calculation, and the color is blue for support and pink for resistance and have slightly different color shades to distinguish when they are on top of one another. These segments represent possible short term reversal areas for the Power Volume indicator.
- The Levels - are the 3 longer lines, that run the width of the indicator, and are longer term support and resistance levels. Like the retracement, they are progressively thicker with the thickest representing the longest duration support level and the thinnest the shortest. The colors are green for support and pink for resistance, and again represent potential turning points for the Power Volume Indicator.
- The Extremes - the red and green blocks at the outer edges of the indicator, that typically represent the extremes (red - overbought, green - oversold) of the indicators range and the potential for an impending market reversal.
The Power Volume Indicator Pressure Boxes will change colors based on the user selected color scheme. The Extremes, Daily Open Level, Close Line, Levels and Retracement Segment parts will not change colors based on the user selected color scheme.
Strategies
- When indicator moves into the red extreme zone, look for a reversal to the downside, and be prepared to go short.
- When indicator moves into the green extreme zone, look for an upside reversal and be prepared to go long.
- Make sure that the Main Trend, the Zones, and Power Probability Calculator are all on your side to stack the odds in your favor.
ALWAYS WAIT FOR Shift of Momentum before you chase tops and bottoms of indicators. Use simple chart patterns or our trade set ups (see our Trading View Community Page for these concepts and more, and for free trade ideas.