Indicators
Probability Power Calculator
Overview
The Probability Power Calculator (patent pending) is based on Marc Nicolas’ Probability Trading and Investing box theory. In this theory, the market and prices fluctuates in ranges and traders and investors are better off asking:
Are we in the top of the range, the middle, or the bottom of the range?
Based on the location, is it better to deploy capital now or wait?
The Probability Power Indicators are unique and generate both divisional and real time probabilities based on our proprietary algorithms and divisions to help you avoid chasing tops and bottoms, and taking low probability trades with a 50/50 chance of success.
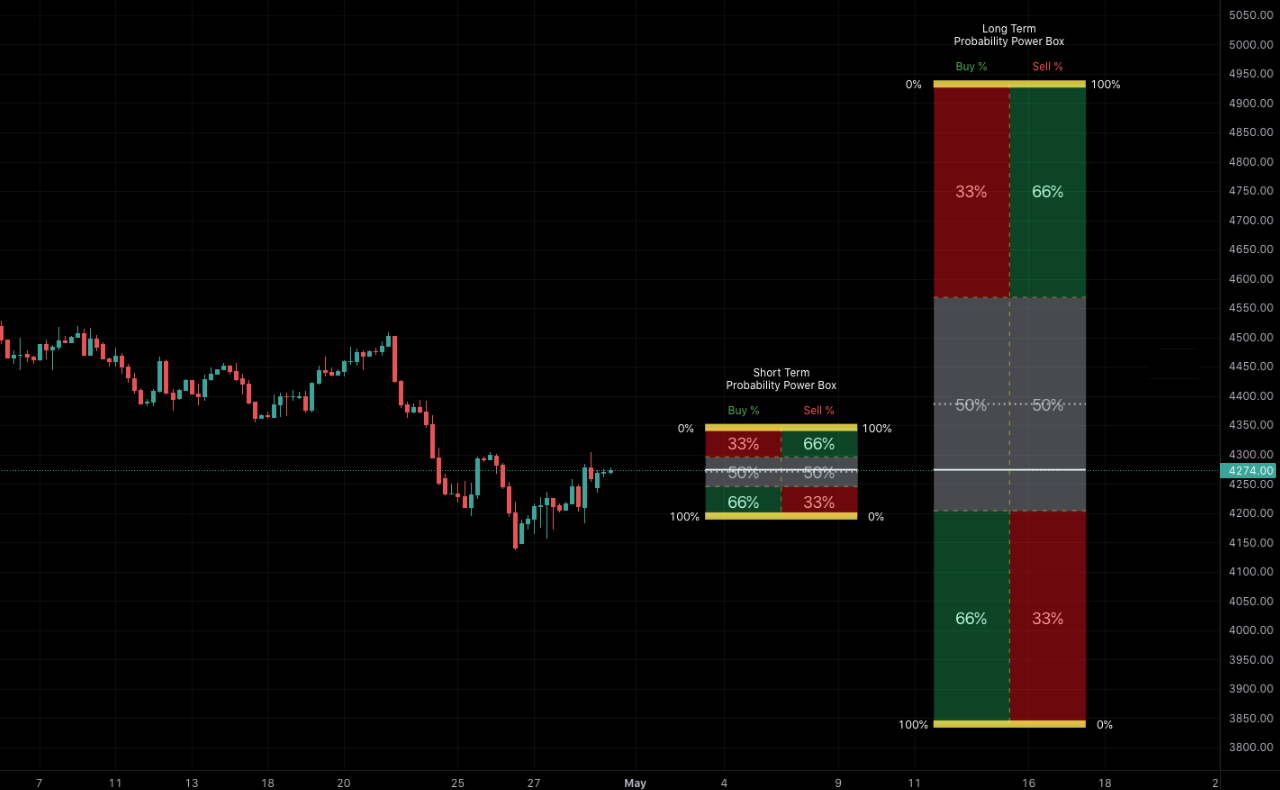
For example, if we take a Power Calculator with the '3 - 33%' division setting, the tops and bottoms of a box are aligned with support and resistance levels and the height of the box is divided into thirds or three 33% buckets.
When going long or buying a stock, the theory says that you should enter in the bottom third of the box, hold during the middle third, and exit during the top third of the box.
When going short or short selling a stock, the theory says the opposite — that you should enter in the top third of the box, hold the middle third of the box, and exit in the bottom third of the box.
In both cases, entering in the appropriate third of the box improves your chances of having a successful trade with a 66% chance of a successful trade when entering in the initial third, a 50/50 chance of a successful trade when entering in the middle third, and a 33% chance when entering on the final third.
The Probability Power Calculator builds on this theory and expands the number of division choices to 2, 3, 4, 5, or 10 divisions of our proprietary range calculations.
THIS CONCEPT, THE DESIGN AND UTILITY IS UNIQUE in the trading and investing industry. It is why we have applied for a patent, trademarks, and PCT International protections and have secured an in-house legal team to protect our rights and enforce the designs, utility, and copyrights against any infringements.
Thinking in trades in terms of probabilities, helps you avoid picking the next high flying, stock market darling stock that is currently making its all-time high or shorting a beaten-up stock that is poised to rebound.
While the divisional odds do cause you to think about the odds of having a successful trade, they are still coarse estimates that can cover a wide divisional price range or bucket. We wanted something better.
Calculating real-time box percentages was the solution. These are real-time updates of the divisional odds, re-calculated on every price update, that provide you with accurate estimates of the probability of reaching the upper or lower edges of the probability box.
The second improvement over the old theory deals with how the box size is calculated. Traditionally the edges of the box were anchored to the nearest support and resistance levels.
In some cases, this would result in a box that was unusable for short term trades (too large) and at the same time it might also be unusable for long term trades (too small), or the range might only work one of them.
Rather than relying on market's support and resistance levels, the Probability Power Calculator capitalizes on the fact that stocks do not move in straight lines from one price point to the next.
It relies on what various studies have shown – that stocks tend to consolidate nearly 75% of the time and trend strongly in one direction or the other the remaining 25% of the time.
The Probability Power Calculator calculates the probable consolidation range based on past price behavior and uses this range as the box size. We do this for both the short term and long term consolidation ranges. We've found that this works extremely well for the short term trading and reasonable well for the long term trading.
When the edges of the calculated box are exceeded AND there is no loss of momentum as the price approaches the box edge and slightly beyond, the odds are that the stock has exited the consolidation stage and will continue to trend to the next support/resistance level, or if level is extremely far away, the next consolidation range.
On the other hand, if the stock is losing momentum as it approaches the edge of the Probability Power Box, there's a high likelihood that the stock may reverse around or at the box edge or slightly outside of the box.
The combination of the two new additions to the box theory - a more precise box range based on the stock's probable consolidation range and real-time updates of the odds of reaching the box edges, provides an enormously valuable situational awareness for both a short term and long term traders. Not only can one determine how much of the anticipated consolidation move remains, but also when it's time to start looking closely at the price momentum for potential reversals.
The net result of using the Probability Power Calculator to evaluate every trade in terms of probabilities, is to steer you towards finding lower risk, higher probability trades where the stock prices are in the appropriate division of their consolidation ranges, or to jump on stocks that are exiting their consolidation ranges and moving in a highly directional manner.
Probability Power Calculator Parts
The Probability Power Calculator (Patent Pending) is unique tool in the Probability Power Indicator™ Suite, as it helps identify in real time, what the current odds for short and long trades between key proprietary order flow and calculated levels. In this section we will detail the various parts of the Probability Power Calculator.
Long Term vs Short Term
The first thing you will notice, is that there are TWO calculators – the Short Term Calculator or Probability Box - which is for day trading and timeframes 1 day and under, and the Long Term Calculator or Probability Box, for use in weekly and longer timeframes.
Because the short-term calculator is not relevant on longer term charts, it is not shown on charts with a higher than 1 day timeframe.
The long term calculator usability, on the other hand, is not limited to just long term trades - knowing where the stock price is within its longer term range, can and should have a significant influence when evaluating short term trades as well.
If, for example, a stock was in the bottom of the Long Term Probability Box and the price was in the lower half of the short term box, you would probably put more emphasis on looking for short term reversals trades that could potentially turn into a longer duration move than you would looking to short the stock and hopes that it will continue its downward move.
REMEMBER: The long term calculator is for Investing and the big picture view but use it with the short term probability calculator to help you maximize and stack the probabilities on your side.
Divisions
The Probability Power Calculator's divisions are mostly a visual aid to help you quickly recognize where the stock's price is within the probability box and are filled with colors to help you recognized the significance of the that division - green for potential entries (Buy/Sell side), gray for neutral - 50/50 zones where you need to play tight, or stick with out of the money income trades like credit spreads or Iron Condors, and red to avoid entering a trade (Buy/Sell side) and for exiting existing trades.
There is no right or wrong number of divisions as it is a personal preference. We typically find ourselves using either 3 or 4 divisions for the short term box and either 4, 5 or 10 divisions for the longer term box depending on the box size. We've heard from our beta testers that they actually use the 2 division option on very short sub 5 minute trades - so pick the number of divisions that makes the most sense to you.
Within the Probability Power Calculator Indicator (patent pending) settings, the possible Division selections will show both the number of divisions and the percentage each division represents.
The boundaries of the individual divisions are the dashed horizontal yellow lines.
Long/Short Trade sides
Both the Long Term and Short Term calculators are split vertically into 2 separate halves by the vertical dashed yellow line.
The left size is the buy or long side, and the right side is the sell or short side. We combined both the buy and sell sides into one indicator so that you would not have to choose which side you wanted to have displayed and can immediately determine the basic strategies you should using and the trades you should be looking for.
Divisional Odds
On each side of the Probability Power Calculator, the same divisional colors are grouped together and assigned an average probability of a successful trade when entered when the price is within that same color divisions.
The buy and sell side have different odds which when added will always be equal to 100%. When the odds are added up vertically, the total on each side will be more than 100%. This is normal as the original box theory compares the buy and sell side odds and not the odds of the long or short divisions.
Box Odds
Box odds are a finer grained implementation of the divisional odds and dynamically update in real-time. If one considers the box to be the expected range, then the number on the buy side represents the percentage of the box or move remaining to reach the top edge.
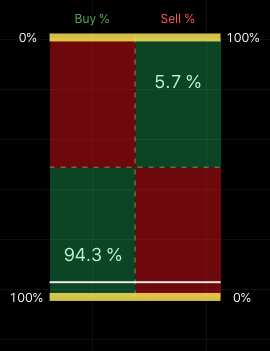
Conversely, the sell side represents the percentage of the box or move to the lower edge. No matter where the price is in the box, the buy side odds and the sell side odds when added together will equal 100%.
As an example, if the buy side has 80% odds, that means there is 80% of the consolidation range remaining before reaching the top of the probability box, and only 20% of the range to the downside. At the same time and at that price, the sell side is the exactly the opposite, were 80% of the consolidation range has been covered at and only 20% remains.
This is the probability box theory in a nutshell - if the box edge represent your potential exit point, do you want to investigate a trade were you risk 4 to make 1 or a trade where you risk 1 to make 4?
Around 25% of the time, we will see the price exceed the edges of the probability box - sometime temporarily as the stock loses momentum, and other times permanently as it moves to a new consolidation range. The box edges are more likely to be exceeded when there is a sharp and rapid move in one direction.
When the upper or lower edges of probability box are exceeded, the box odds will be removed. They will reappear when the price moves back inside of the box.
If the price exceeds the box edges, be on the lookout for a shift or slowdown in momentum. If one occurs, the odds are the stock will reverse back into the box where the entry becomes a good possible entry point.
If the momentum does not slow down, look for the opportunity to jump on the trending stock for a ride to the next support/resistance level.
Always use the other Probability Power Indicators in synergy with the Probability Power Calculators. Keep an eye on the trend, Power Volume Indicator, Power Elastic Bands, Power Cloud, etc. DO NOT RELY on the Probability Power Calculators alone! Stack all the indicators together for higher synergies and proper entry and exit decisions.
Solid White Line
The white line is the current price and is only shown when the price is contained within the box.
Dotted White Line
On divisional choices that do not have a boundary at 50% of box - the 3 and 5 divisions - a dotted white line is drawn at the 50% as a reference point. Some of our testers found this useful for quickly determining where in gray zones the current price was located.
Strategies
Some people use the divisions and/or the box percentages to filter a list of stocks to determine if it is worth the effort to review as a potential trade. They do this for both short term - today and this week potential trades, and long term – for longer trades and potential assets to accumulate.
Others look for stocks where both the long-term and short-term probabilities are aligned - either both are in the lower buy side for a long trade or both are in the upper sell side for a short.
When looking for long term assets to accumulate, you want to search for stocks that are in the bottom third of the long term probability box, as you'll stand a better chance of acquiring a stock that has the potential to move up again. Be cautious and make sure that the stock has a long term business model will allow it to remain in business - you don't want to acquire a pay phone company when the cell phones were introduced, or Kodak when the photography business begins going digital.
In extended and rapid up and down moves, the expected range of the Probability Power Calculator may not cover the prices. This is normal and represents a time when the market forces overpower the expected consolidation ranges and cause the stock/index to strongly trend in one direction. When this happens, make sure you adjust your trading strategies to adapt to the new market normal for the duration of the event.
When the expected range is exceeded, use the other Power Indicators - Trend, Power Cloud, Power Volume Indicator, Elastic Bands, Power Targets, etc. - to generate synergy. DO NOT RELY only on the Probability Power Calculators ALONE! Stack the Probability Power Indicators together to generate higher Synergies and proper entry and exit decisions.
Settings
The Probability Power Calculator has 6 settings - several which are related.
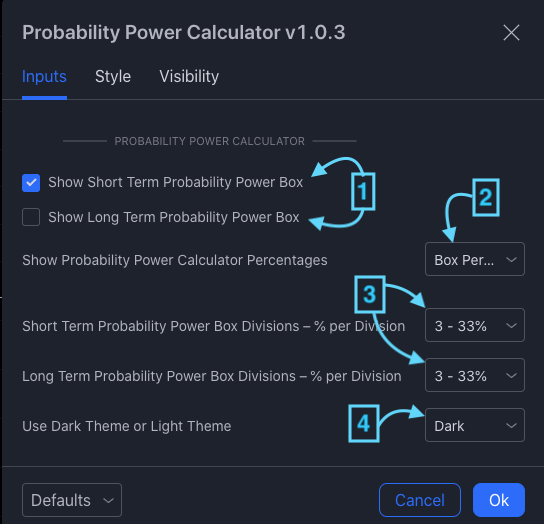
Settings indicated by (1) determine whether the short-term and long-term Probability Power Calculators are shown. The defaults are to show both calculators.
Setting (2) controls whether Box Percentages, Divisional percentages, or no percentages are shown in the Probability Power Calculators. There is one selection for both short-term and long-term calculators and the default is Divisional Percentages.
Settings (3) set the number of divisions for the short-term and long-term Probability Power Calculator. The default is 3 divisions of 33%. The menu items have both the number of divisions and the percentage each divisions represents.
Setting (4) determines if the Probability Power Calculator should be drawn with appropriate colors for Trading View's Dark Theme or the Light Theme. The default is to use the Dark colors.
Summary
To summarize, for both the long term and short term calculators, the box size is dynamic, represents the estimated consolidation range and changes from day to day – even intraday as the market conditions change.
The divisions are always a percentage of the box - e.g., three 33% divisions, and the percentage odds of these individual divisions are fixed if you choose the divisional percentages.
The box percentage, on the other hand, dynamically change based on the percentage of the box size remaining for the move.
Picking trades that are in the green division of the respective buy/sell side have a higher percentage of successful trades than choosing trades in the grey or red zones.