2022-04-19 AAPL – scalping trades #
This is an example of two short-term intraday trades in AAPL on April 19, 2022.
The first came when the Power Elastic Bands showed a divergence from the price chart at 10:50am AND the price was bumping up against two Major Power Zones with a red Institutional dash right above it. The short-term Probability Calculator showed that there was a high percentage (78.6%) chance that a downward move toward the lower edge of the probability box was expected and the MACDs were starting to roll over and was the broader market as indicated by the Power Volume Indicator.
AAPL 5 minute Chart
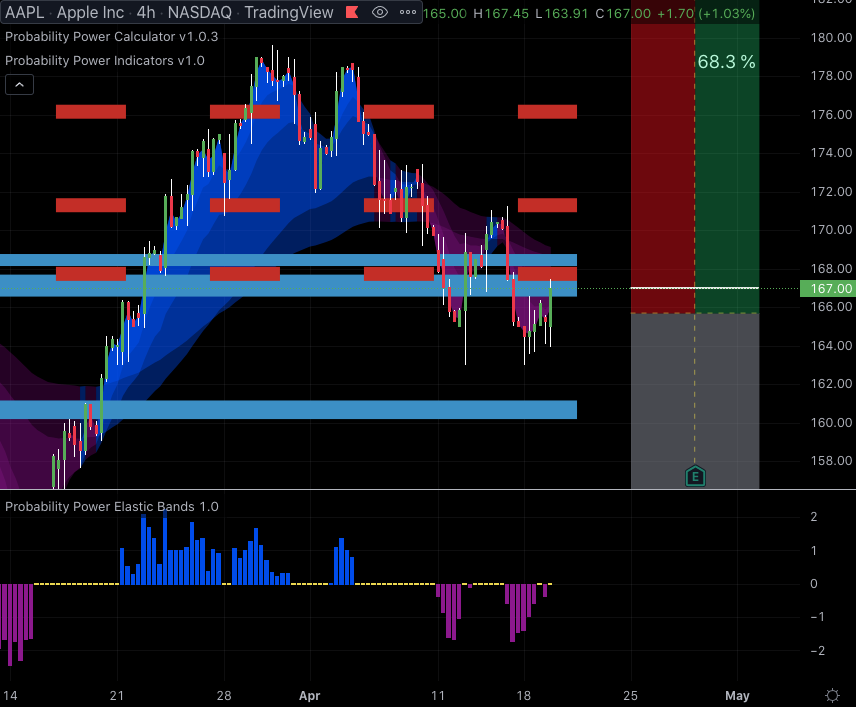
On a longer timeframe chart – the 240 minute in this case – it could be clearly be seen that AAPL’s main trend was still down in spite of the double bottom formed on April 12 and 18th. (Down trends remain in place until the Power Cloud changes colors.)

AAPL 240 minute Chart
Taking a short trade would have resulted in a gain of approximately 1.19% in roughly 3 hours. Note how momentum shown by the standard 12, 26, 9 MACDs and its histogram started to falter as it approached the zero line. This was our clue to get out, as the downward move was about over. It was reinforced by the double bottom around 2:15pm with no real movement in the MACDs.
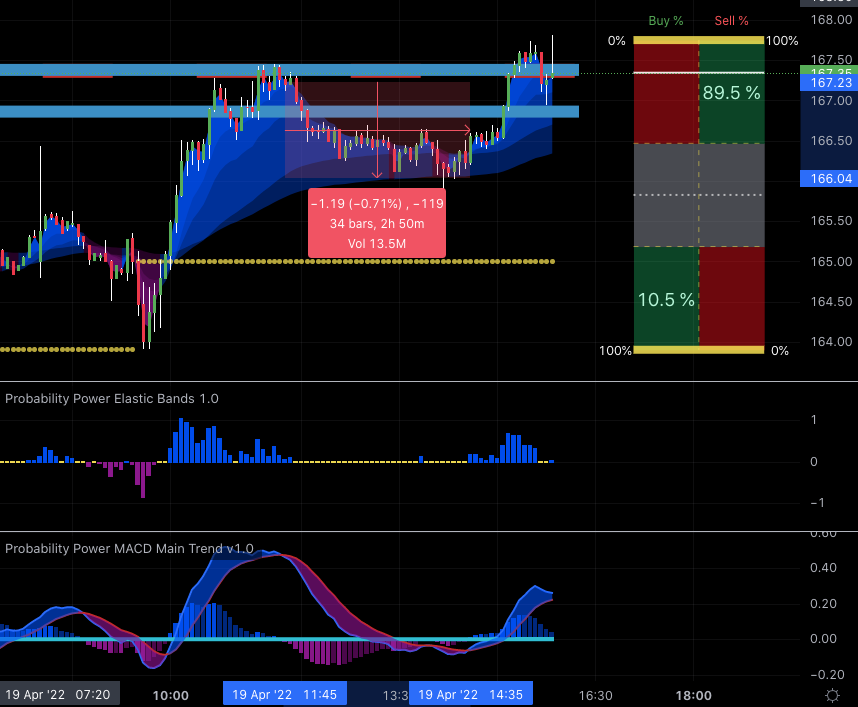
Second AAPL 5 minute Chart
Doing a reversal trade was not advisable, as the price was in the gray neutral area on the Probability Calcuator and would have been a counter trade to the main trend. Waiting a bit until around 3:30pm resulted in a quick spike up and the price crossing and recrossing the red Institutional Zone and a Major Power Zone, along with the Probability Calculator indicating that AAPL was once again in a good short location with a 8.5% chance of downward movement, with the price making a higher high and the MACD diverging with a lower high. The problem was the signal came late in the day you have to determine if you wanted to hold the trade overnight where the short term pattern might play out with no way to exit the trade.
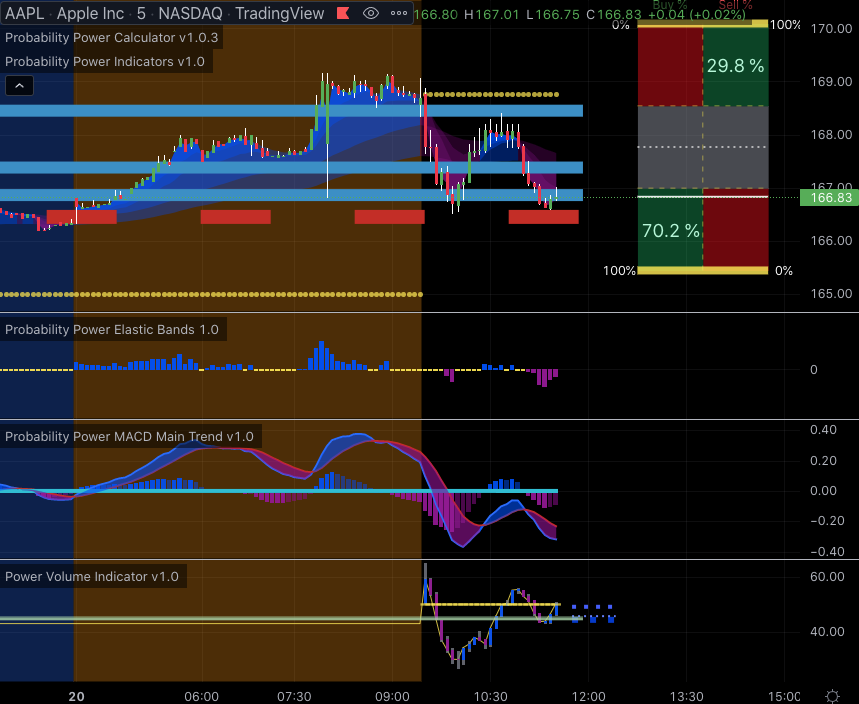
AAPL on 4/19 5 minute Chart
Given that it was a short-term signal (5 minute), it didn’t make sense to take the risk. I did put AAPL on my watch list for the next morning… which was a good thing as it was in a position to take another short term day trade at the open with the MACD and the Power Elastic Bands indicating an possible sell off.
Had I missed the opening sell off, the retracement back to the Major Power Zone aorund 10:40 on April 19 would have been a good opportunity to enter a short trade even though the Probablity Power Calculator wasn’t quite in Green Zone for a short.
The opening sell off was good for 2 points in 30 minute, and the bounce back to the Major Power Zone and subsequent sell off was good for 1.50 move in 40 minutes.
The key to these Day Trades is to trade in reduced sizes, trade with the main trend, and to fade the trades. When you fade the trade, it means to exit a portion of your position for a profit, and giving yourself additional protection in case the trade goes against you. If your trade size is 5 option contracts, you might exit 2 of them when you have made a profit of 20% and hold the remaining 3 as runners, and exiting the final 3 as opportunties arise. You will make less than the maximum gain, but it will allow you to particpate in more of the move while limiting any losses by booking the profits earlier.


