The Power Trend Box is part of the Probability Power Indicators and consolidates proprietary trend and volume signals into one easy to use table or box.
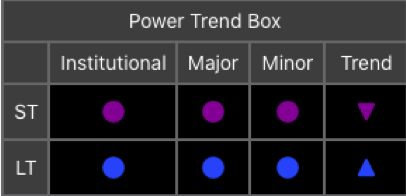
The Power Trend Box is broken down into two main categories – short-term (ST) and long-term (LT). The short-term category is intended to be used for day trading, whereas the long-term category is intended to be used for swing or position trading.
Within each category, there are appropriate trends that represent Institutional, Major and Minor trends based on volume. These trends are evaluated and when the majority of these trends are in agreement, the overall category trend (short-term/long-term) is set to the appropriate up, down or sideways/neutral direction. When the direction is set to sideways/neutral, it is either a beginning of a momentum shift, the resumption of a previous trend, or a no-go trade.
Power Trend Box Options
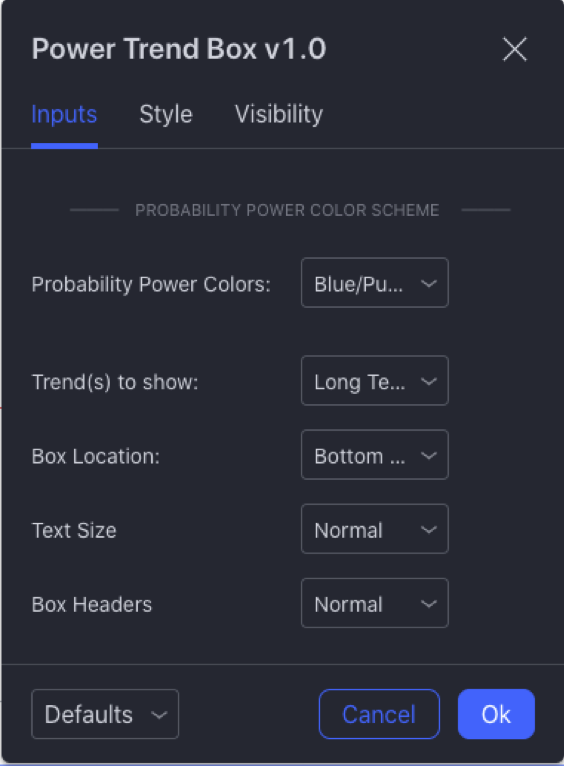
There are multiple options within the settings dialog that allow the user to customize the Power Trend Box table. Settable options include allowing the user to select the position of the table or box, their choices of the trends to display, the table text size, and even allows the table headers to be abbreviated to reduce the box size.
Power Trend Box Setting Dialog
Trend(s) to show allows the user select which trends to show – the short term trend only, the long term trend only, or both the short and long term trends.
The Box Location option allows the user the flexibility to set the display location of the Power Trend Box to any of the nine possible locations – from upper left corner to bottom right corner – Trading View allows tables to be positioned.
Text size allows the user to select their choice of text size which controls the size of the Power Trend Box on their screen. For Windows users with high DPI screens, either ‘Normal’ or ‘Large’ will most likely be the correct setting.
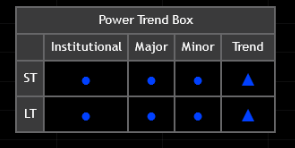
The Box Headers allows the users to abbreviate the headers Power Trend Box to reduce the overall width of the box.
Power Trend Box in a Standalone Pane
The Power Trend Box by default is setup to be an overlay on the main price chart. The user can setup the indicator to occupy a separate pane on the chart by selecting the three dots at the end of the indicator line on the chart, selecting the “Move to” menu item and then selecting the appropriate pane to move the indicator into. The pane occupied by the Power Trend Box indicator can also be manipulated in the object tree (the right icon menu bar, three sheets icon or via right clicking on chart and selecting the ‘Object Tree…’ menu item).
Power Trend Box Alerts
The Power Trend Box incorporates Trading View’s Event Alerts so you can set up alerts to be notified of the trend changes. To do this, select the Power Trend Box option in the condition popup in the create alert dialog.

Power Trend Box Setting Dialog
The alerts are current set to fire off when the trend changes from up to down or down to up and only the FIRST time it changes within a given bar. This was intentionally done as the indicator can fire off multiple times within a given bar as the trend oscillates back and forth, and rather than needless multiple notifications, a single notification of a potential trend changes was determined to be sufficient. Trend changes are confirmed to have changed when the bar is complete or finalized.
The remainder of the alert setting dialog box options are standard Trading View Alert options. You can find out more information regarding the options and their settings here.
Power Trend Box Usage
The Power Trend Box is intended to be used in conjunction with other Probability Power Indicators and Probability Power Calculator. When combined with the Red Institutional or Major Support and Resistance Zones and the Probability Power Calculator, the Power Trend Box will provide you with a clear map of the highest probabilities for a successful trade.
Videos with examples using the Power Trend Box indicator can be found on Power Indicators YouTube web page.
Power Trend Box Visibility Issue
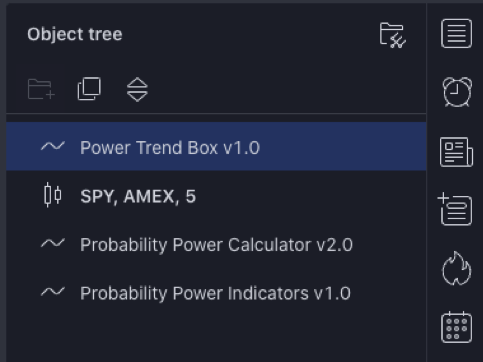
When the Power Trend Box is drawn in a chart pane with multiple other indicators – such as price, volume, or the Probability Power Indicators, it must be the topmost object in the chart’s object tree to prevent other indicators and prices from being drawn over it. You adjust the chart object ordering by opening the Object tree (either right click on chart and select the ‘Object Tree…’ menu item or selecting the three-sheet icon in the right tool bar at the bottom) and in the resulting drawer, drag the Power Trend Box to the top of the object tree. When done correctly, your object tree should look something like the following depending on which indicators you have selected:
Power Trend Box Setting Dialog
Ordering the chart objects in this way will ensure that no other indicator or price plot obscures the Power Trend Box.
Power Trend Box Limitations
While Trading View does limit the amount of historical data available to the user depending on the user’s subscription level, these limits normally do not affect Power Trend box historical data needs for calculating the current day’s Power Trend Box trends when in normal or replay modes.
The Power Trend Box does, however, require a certain amount of historical data to be able to calculate the trends. Newly issued tickers with less 1 year of historical data may have issues calculating a long-term trend, and those with less than 6 months of historical data may have trouble showing the short-term trend.
The Power Trend Box currently cannot be used as a criteria for the Trading View Scanner due to the scanner’s inability to use custom Pinescript. Trading View has publically indicated that they are working on a major revision to the Scanner component to allow custom Pinescripts. When Trading View releases the revised scanner we will revise the indicator to allow it to be incorported into scans.


