The Probability Power Indicators™ is a suite of 6 tools that have been combined into one indicator. The tools are designed to be overlayed on a price chart and help the user evaluate the probabilities of a continued price move vs a price reversal.
The indicators stack probability on probability for a greater percentage outcome, design by real traders for traders in real market environments without false promises of 100% chance of a win on any trade. Use the indicators to help confirm your asumptions before investing and trading.
The tools in the suite are NOT meant to be used as a specific buy or sell timing indicator, but rather to identify areas of where there exists a higher probability than normal for a change in price behavior. One needs to use these tools in conjunction with specific chart formations such as a Double Tops and Head and Shoulders patterns, appropriate trading and investing strategies, and sound risk management to be successful.
Each of the tools serves a specific need and depending on the market conditions and your trading style, you may not need all of them. Each of the 6 tools has been isolated to show just that tool below, along with a description of what it does and why it is important.
To learn how to use the tools in conjunction with with one another, subscribe to our YouTube channel so that you will not miss any new case study or how-to video on the indicators, and join our Discord group to participate in our daily discussions.
Institutional Power Zones #
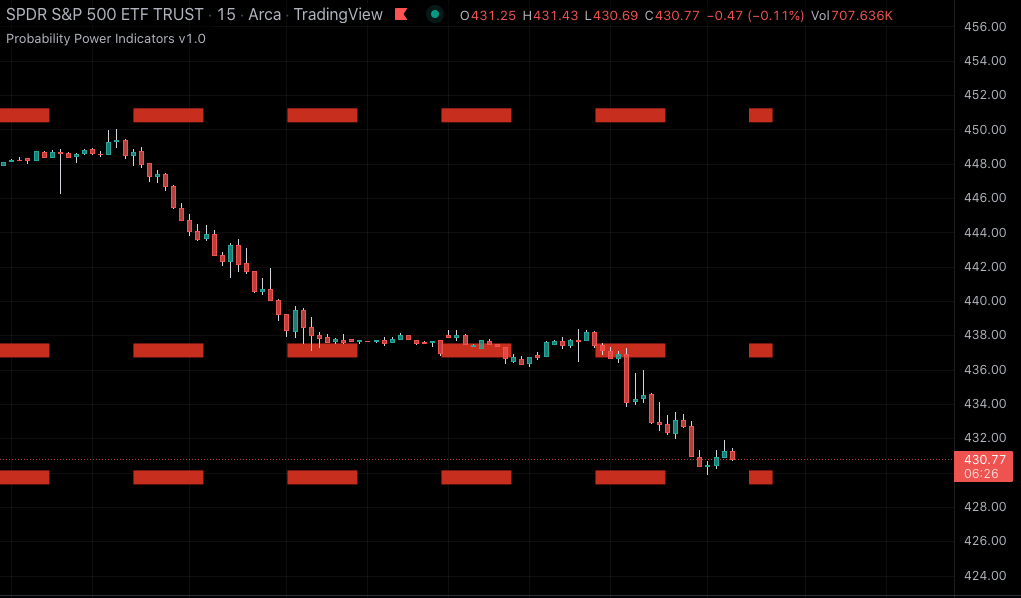
The most significant tool in the Probability Power Indicator suite is the Institutional Power Zones — which are used to identify areas or zones on the price axis where institutions are likely to change their longer term buying or selling behavior and/or strategies.
The red Institutional Power Zone prices levels are not fixed static zones but are dynamically adjusted over time based on past price behavior. For intraday charts, there can be up to 5 different zones, while on daily and longer timeframe charts there are a maximum of 4 zones.
Markets typically move from one red Institutional Power Zones to another. The zones can be either major Support or Resistance levels, depending on their relation to the current price.
When looking for a price reversal at the Institutional Power Zones, you are typically looking for the price to approach and slightly exceed the zone while losing momentum. The characteristics of the loss of momentum are the same as a soccer ball kicked up a hill when it slows down right before it reverses direction.
If the price blast through the zone without any loss of momentum, it is likely that the market forces are strong enough to overcome the institutional resistance for that zone. Use the synergies of other indicators such as the Power Clouds, Power Elastic Bands, and Power Volume Indicator to confirm the break.
If the price crosses and recrosses the Institutional Power Zone levels, you need to pay special attention to it as it is likely building up energy to make a sustained move and about to shift momentum.
The Institutional Power Zones are NOT affected by changes to the Indicator Color Scheme. They are simply too important to have a different color based on the user selected color scheme.
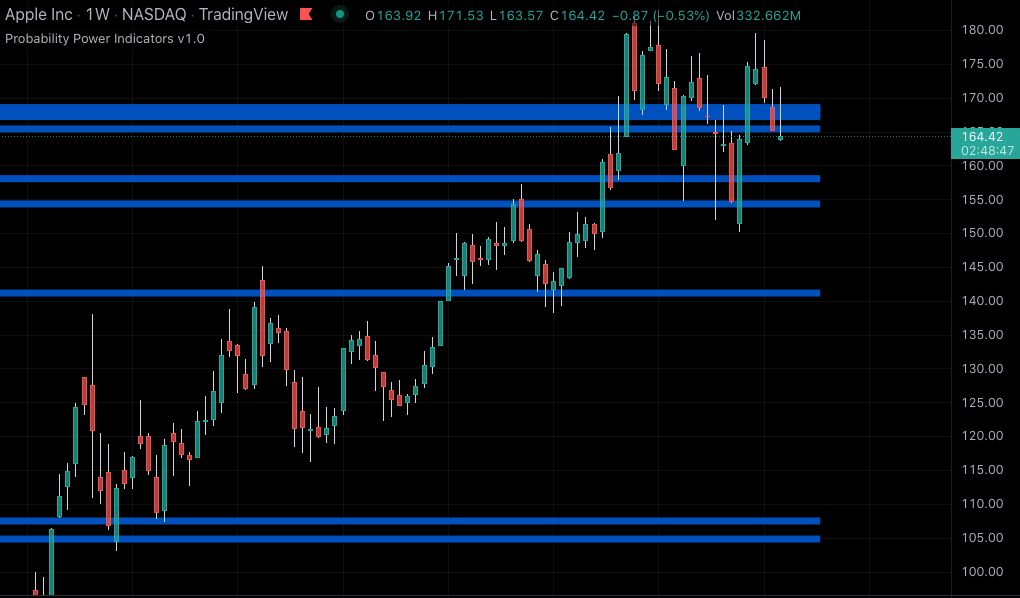
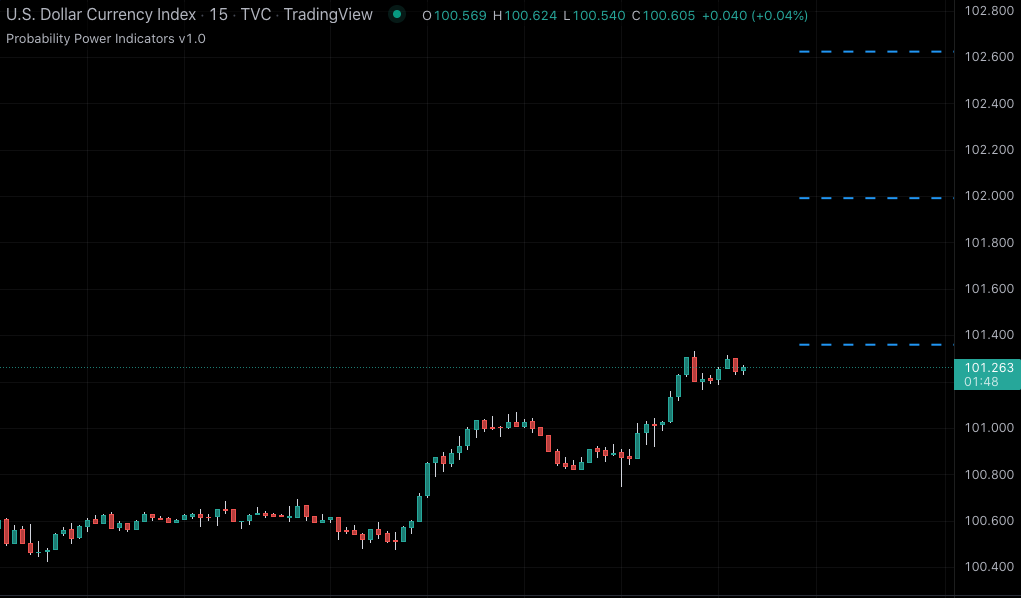
Major Power Zones #
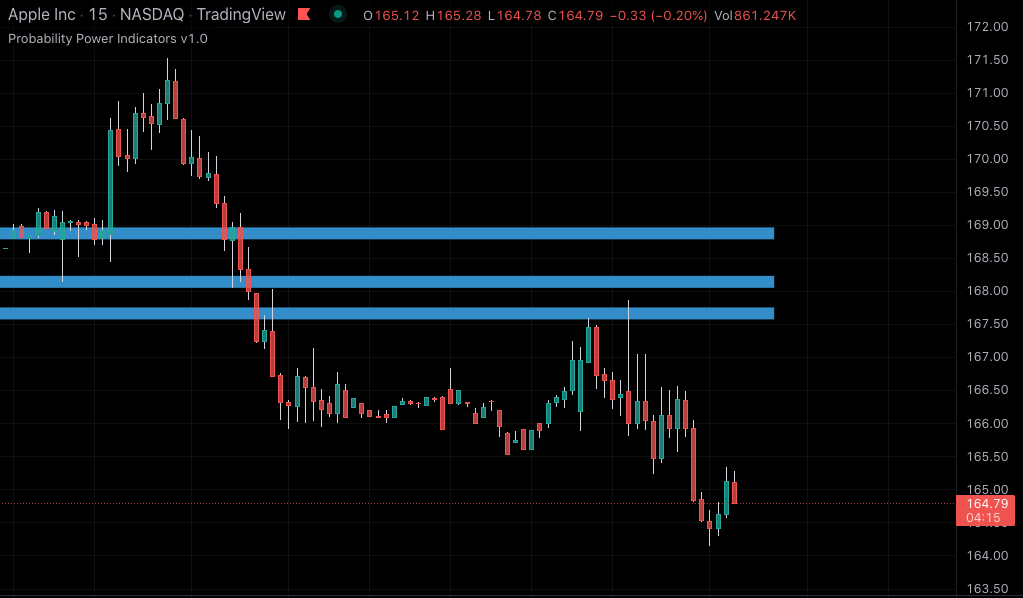
Slightly less important than the Institutional Zones, are the Major Probability Power Zones. These are price areas, where retail and institutional traders are likely to cause the prices to consolidate for a time and potentially reverse.
They can be used for upside or downside price targets and for trade entry or exits as the prices cross and recross these levels. These zones are typically derived from past market price behaviors.
The same tricks you use to watch for reversals at the Institutional Power Zones can be duplicated here – just with a slightly reduced level of importance.
The Major Power Zones will change colors based on the user selected color scheme. The Major Power Zones are the lighter in color than the Minor Power Zones. The image above shows the “Blue/Purple” color scheme.
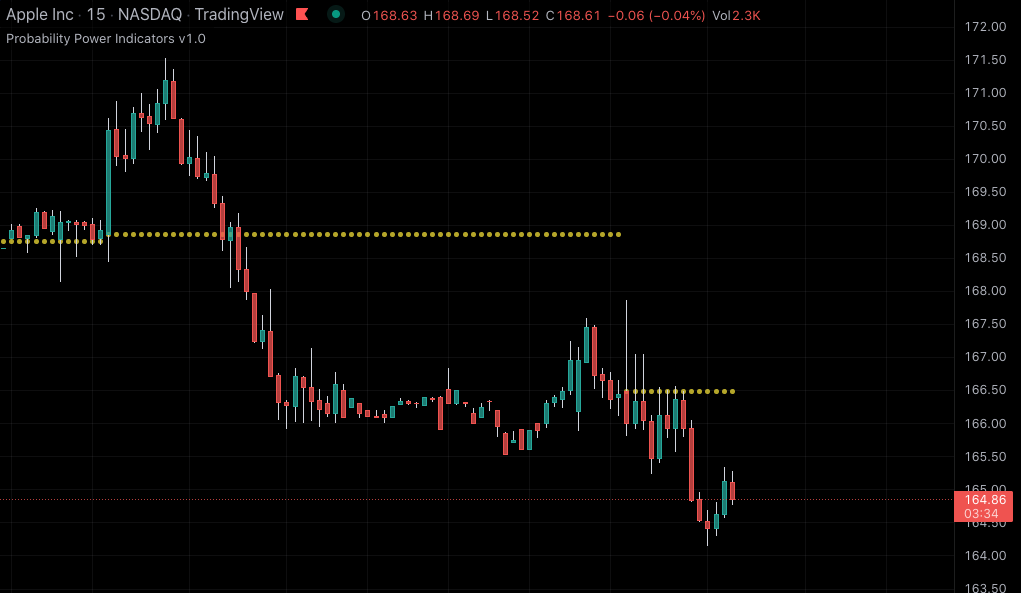
Minor Power Zones #
The Minor Probability Power Zones are more numerous and less important than the Institutional Zones and the Major Probability Zones for investing. They are still significant enough for day traders to be called out and serve the same purpose as their more important siblings in a reduced role.
The Minor Power Zones are typically turned off by default and turned on only when there is a large void or space between the Institutional Power Zones and Major Probability Power Zones, where the trader needs something to help navigate the void between indicators.
The Minor Power Zones will change colors based on the user selected color scheme. The Minor Power Zones are darker in color than the Major Power Zones. The image above shows the “Blue/Purple” color scheme.
Probability Power Cloud #
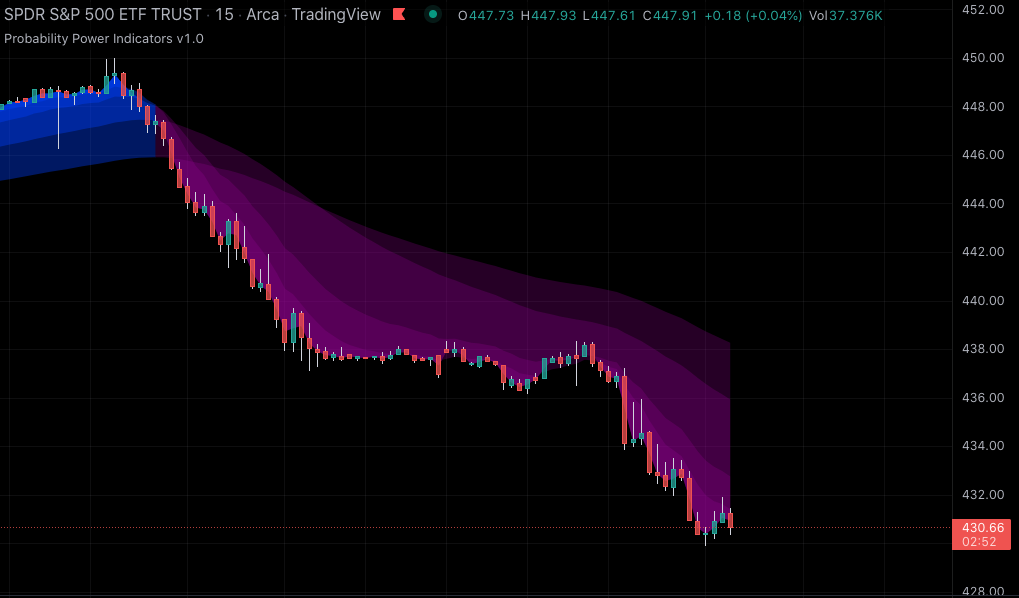
The Probability Power Cloud tool has several functions. Its primary task is to help you visually identify the current trend as the price moves between the various Institutional, Major and Minor Power Zones. This helps keep you on the right side of the trend and prevents you entering a low probability counter-trend trade that is likely to turn into a loss.
Once you are in the trade, the cloud’s secondary function is to help keep you in the trade by confirming that the current trend remains intact for as long as the cloud’s color remains consistent. This prevents you from exiting a trade while there is still high probability that the trend will continue.
The third function is that the edges of the cloud’s color bands represent areas between the zones where resistance and support levels are likely to be found within the trend. This helps you watch identify locations where the price momentum may slow and potentially reverse.
The fourth function of the Power Cloud is to inform you of changes to the tone of the market. When the slope of the clouds bands start to flatten out, there is a high likelihood that the market is undergoing or about to undergo a significant momentum shift and/or pause of momentum.
You will likely see some instability in the cloud color – which some call a ‘zebra’ pattern – when the market is about to make a significant shift higher or lower.
The Probability Power Cloud will change colors based on the user selected color scheme. The image above shows the “Blue/Purple” color scheme.
Power Targets #
Sometimes market volatility can cause prices move so rapidly they exceed the ability of the Institutional Power Zones to adapt. When this happens, the Probability Power Targets are displayed and represent potential levels that prices may reach beyond the current Institutional Power Zones.
These targets will be displayed if the price is above/below the highest/lowest Institutional Power Zone level.
The Power targets will NOT change colors based on the user selected color scheme.
Daily Open #
The Power Open is included for US stock and US future day traders. It is only displayed on timeframes less than or equal to 30 minutes and is useful in helping traders gauge the current short-term tone of the market.
Above the 9:30am Power Open, the market has a positive tone, and below a negative tone. The Power Open is not shown on Crypto or Forex charts as these markets trade 24×7 and there is no traditional opening.
We currently do not support international market opening times. If there is enough interest, we will adapt the Daily Open to handle international markets.
Probability Power Indicators Settings #
The following section details the available settings for the Probability Power Indicators™. Exception for the Probability Power Color section, the available settings turn on or off the particular tool. By default, all of the tools are on except for the Minor Probability Power Zones.
The Probability Power Color section is discussed in the Indicator Color Scheme section.