This page contains a collection of Trading View hints to make your trading life easier. If you have a hint that is not listed here, please send it to contact@powerindicators.com.
Chart Settings #
Creating Default Settings #
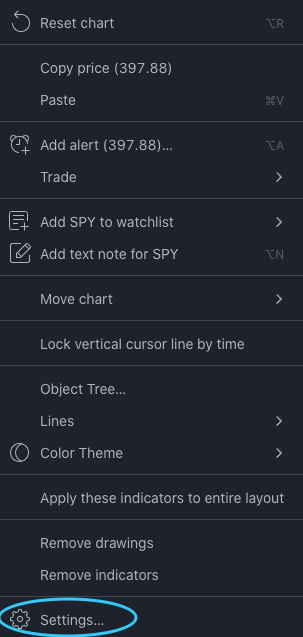
You can access the Chart Settings dialog via right clicking on a blank area, and selecting the Settings menu item from the resulting popup:
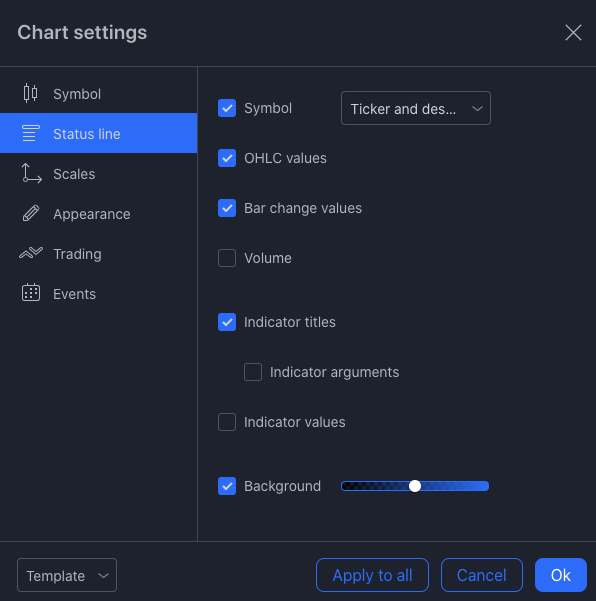
In the resulting dialog, you can customize various aspects of the chart.
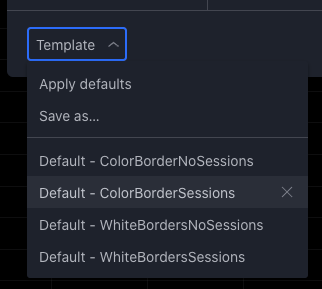
Once you have Chart Settings arranged to your liking, save them as a chart template by selecting the template popup in the lower left of the dialog box, selecting “Save as…”, and providing an appropriate name. You can remove existing templates via the “X” to the right of the template name.
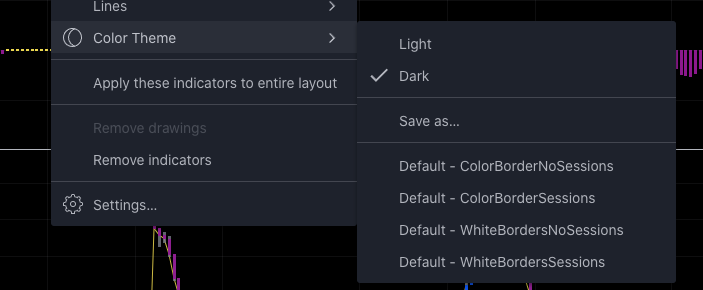
You can then recall a particular set of chart settings by opening the Chart Settings dialog and then selecting the appropriate template from the template menu, or you can select the chart settings template via right clicking on a blank area of the chart, getting the popup menu, selecting the “Color Theme” menu item and then selecting the appropriate chart setting template from the submenu.
Creating Ultra-Black Charts #
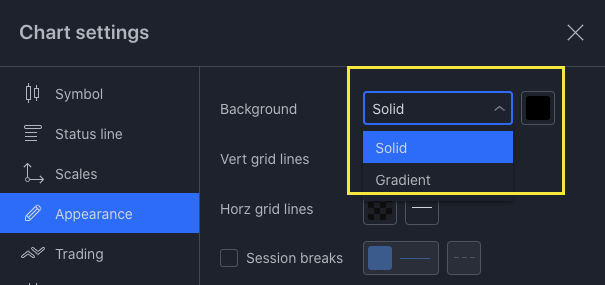
The default chart background in Trading View is a grayish black with a gradient. If you want a solid black background for your chart change your chart background settings to solid, then select the right most black color in the color box next to it. If you prefer, you can choose a color other than black. We recommend not selecting a color that matches one of the indicator colors such as yellow.
Once you have the colors set to your liking, save a chart template – Default in my case, that will serve as a base chart settings template for all your additional changes.
Better Candle Colors and Wicks #
I’m not a fan of the default muted colors and same-colored wicks used by Trading View. Instead, I’ve modified my candle body colors (Chart Settings, Symbol pane) to be a brighter red and green, set the borders to an off-white to make them more visible when on top of indicators, and set the wicks to white.
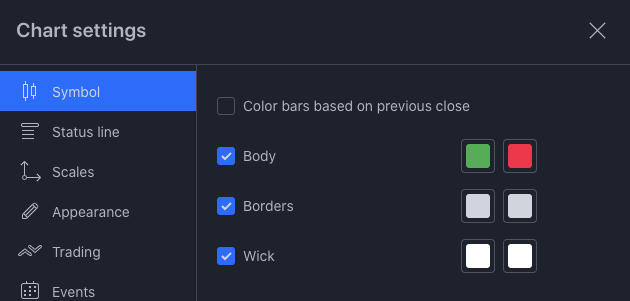
If your charts tightly compressed and the candle width is small, you may want to create another template with the borders to the same color as the bodies to make it easy to identify the color. Where’s what each choice looks like – default, colored borders and white wicks, white borders and white wicks, compressed white borders and white wicks:

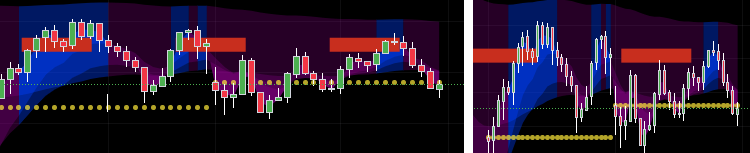
Whether you copy one of these styles, or create your own, you’ll find Trading View is quite flexible in when it comes to candle and wick colors.
Sessions / No Sessions #
Sessions are a pain if you have intraday charts. When you want them – they are invisible, when you don’t want them – they are visible. To make matters worse, their visible default state is hard to see. To get around these issues, you need to save two templates – one with sessions, and the other without. (See how to set chart templates in the Chart Settings section above.)
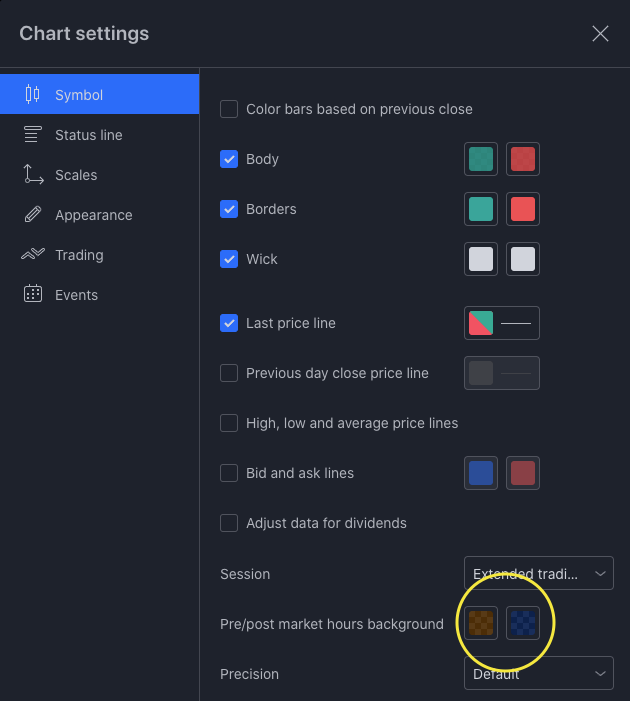
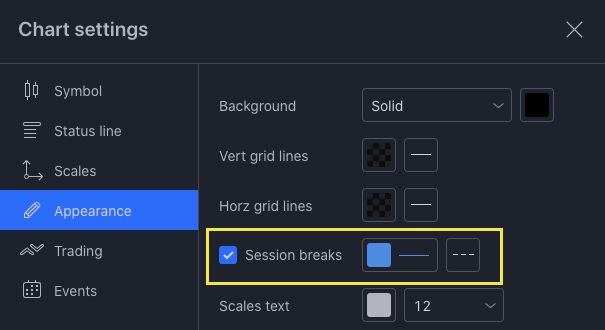
Normal session colors are a transparent orange for pre-market, and a transparent blue for post-market hours – but the opacity is too low. So, on the visible session template, set the pre and post market background’s opacity to somewhere between 20% and 30%. On the non-visible sessions, set opacity to zero. You can find the pre/post market color settings here:
Once you have two appropriately named templates, you can quickly drop into the Chart Settings dialog and switch to the appropriate template. Alternatively, right click on the chart, select the Color Theme menu item, and then the name of the template in the resulting sub menu.
As an alternative to session background colors, you can explore the session breaks line
Getting the price axis to scale correctly #
By default, the price axis will scale to include ALL indicators – including those that are far away from the current price. This causes the price candles to be reduced in size – often to the point where they are unusable.
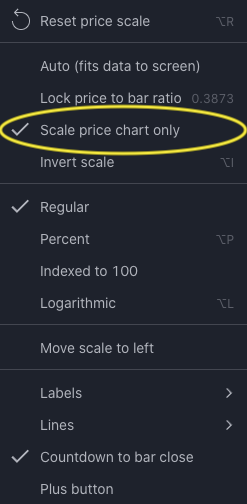
To work around this, you can set Trading view to scale the price axis to just the price range plus the Chart Settings’ Top and Bottom margins. Do this by right clicking on the price axis and making sure that “Scale price chart only” is checked.
Setting the Precision or removing Zeroes from price axis… #
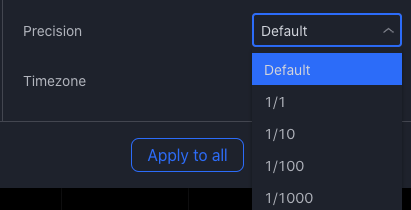
With cryptos, you will often have way too many zeroes in the price axis, wasting space without providing any real value. To get rid of the extra zeroes, simply change the precision value from default – where the exchange sets the number of zeroes shown – to 1/100 for two decimal places in the Chart Settings, Symbol pane, Precision popup in the lower half of the dialog.
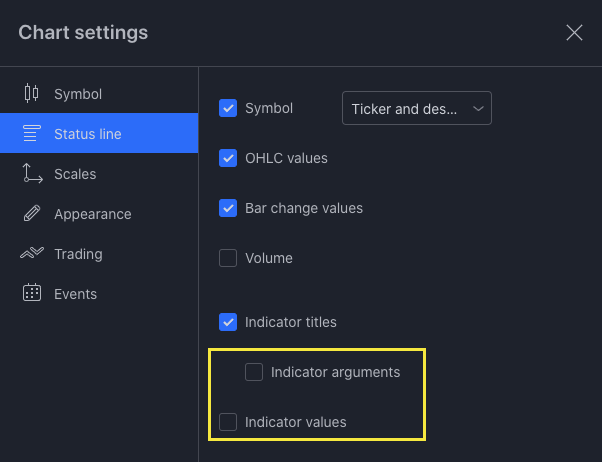
Removing Indicator Arguments and Values #
By default, the indicators placed on the chart will shows their argument settings and values.
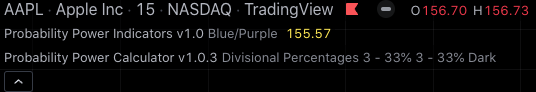
You can remove these by unchecking the following check boxes.
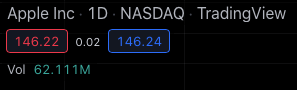
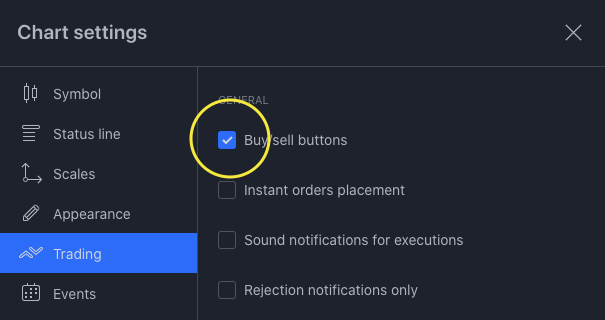
Removing Buy/Sell Buttons #
By default, Trading View places the Buy/Sell buttons on the chart. These buttons interact with any enabled integrated brokers and contain the Bid and Ask within the buttons and the Bid/Ask spread between them.
If you are not using an integrated broker, you can remove them by unchecking the following box:
Indicator Templates #
Indicator templates are a way to organize sets of indicators for application to a single chart – the one highlighted in a blue outline if you have multiple charts on the same tab.
For example, you may have one set of settings for the ES and NQ futures where you include the Power Volume Indicator, another set for stocks without the Power Volume Indicator, and a third for cryptos – with each template containing a different set of indicators.
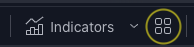
These ‘sets’ of indicators are easily created. Start by make sure that you are signed in and then add the indicators to the chart highlighted in blue and arrange the chart panes in the order that you want them. Use the 4 square icon to the right of the indicators to save the indicator template with your preferred name.
This indicator set will be stored on the Trading View servers and will be accessible across all instances of your account. You may, however, need to refresh the other windows in the current Trading View instance and in open windows in other Trading View instances to obtain the updated indicator sets.
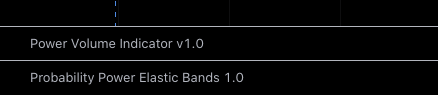
Once you have the templates set up, you can then quickly switch between indicator templates, by going to the indicator template menu and selecting the appropriate indicator template.
Chart Layout Templates #
Once you have your Indicator Templates and Chart Settings Templates set up, it is easy to set up your Chart Layout Templates that covers the layout of either a single or multiple charts on the same tab. Do this by selecting ‘New Chart Layout’, and then setting up the chart(s) exactly the way you want them, using the appropriate Chart Settings Templates and Indicator Templates, and then saving the chart layout template. Alternatively, you can select ‘Make a Copy…’ of an existing chart layout template (load it first), and then make modifications.
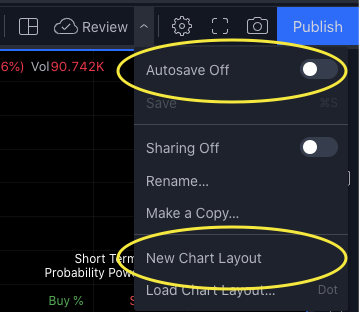
Chart Layout Templates when correctly set up, allow you to have several different chart layouts that serve different purposes. You can quickly switch between the chart templates either by the Chart Layout menu or via using the period/dot key to pull up a list of saved chart layouts.
The fly in the ointment is that Trading View has implemented an auto save feature. If turned on, any changes made to a chart that was created from a saved chart template will automatically save those changes to the chart template. So, if you temporarily change the timeframe on one chart of the chart layout from a Daily to a hourly timeframe and the auto save feature is on, the timeframe change will cause the chart layout template to be updated.
Most people will not want this functionality, as a temporary change can destroy a carefully created layout template. To turn off the autosave, make sure the “Autosave” toggle in the Chart Layout Template menu says “Autosave off”.
A quick side note, using the “Dot” or period key will bring up the layout’s selection dialog. Currently, selecting a layout will open a new tab rather than applying the layout to the current window.
Charts #
Scrolling #
If you have a scroll wheel mouse, the following short cuts will be helpful. (CMD/CTRL – choose the appropriate key depending on MacOS/Windows OS when scrolling mouse wheel.)
- CMD/CTRL – scoll – expands chart timeline from current mouse location
- SHIFT – scroll – move chart right or left on mouse scroll
- CTRL/ALT – scroll – expand/contract chart to the left/right on mouse scroll
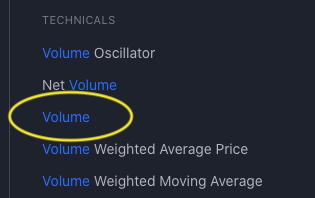
Volume #
Volume is an indicator on the chart. To remove it, simply remove the indicator in the normal fashion. You can also move it to a separate pane if you do not want it in the price chart, but still want it visible.
You might be able to get away with adjusting the chart setting’s bottom margin to gain some more space between the price chart and the volume, but Trading View has limits on the margin settings.
Moving indicators around #
Occasionally, you may find that you accidently move an indicator to another chart pane. You can easily undo this by selecting the ‘3 dot menu’ at the end of each indicator and selecting the menu item “move to” and selecting the appropriate up/down pane,
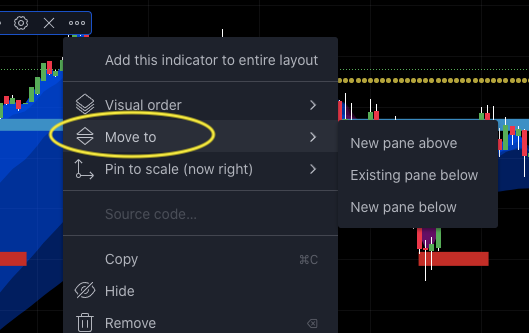
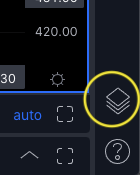
or use the ‘Object Tree’ – three sheet icon in lower section of the right tool menu – to manipulate the indicators to the right pane.
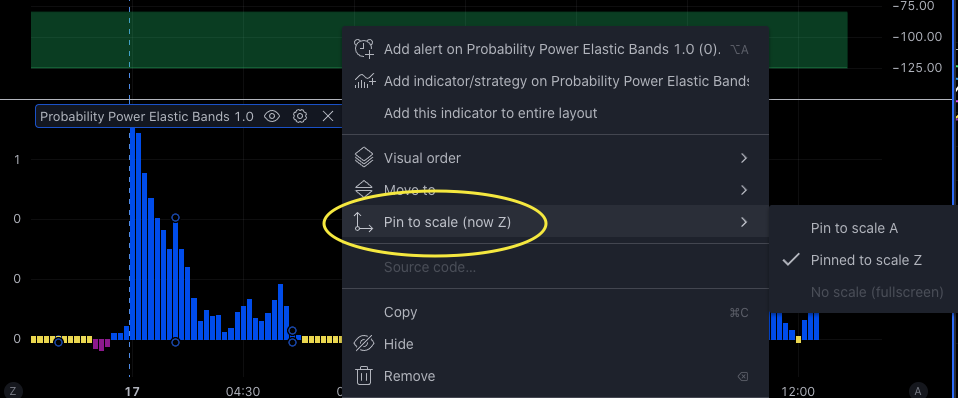
Price axis on the left side of the chart #
When the indicators are accidently moved around, they might end up in a pane with an indicator that uses a different scale. When this happens, Trading View moves the scale to the left side of the chart. To fix it, first move the indicators back to their appropriate panes, and then select the ‘Pin to scale A’ submenu option.
Focusing on one chart #
Sometimes when you have multiple charts in the same tab, you might want to temporarily expand and focus on one specfic chart. You can easily do this by option clicking on the chart you wish to expand to the full tab in a blank area. When done, option click the blank area of the chart to restore it to its normal position.
Focusing on one chart pane #
Sometimes you might want to focus on a single pane of a multiple pane/indicator chart. Simply double click on a blank area of the chart. Double click to restore the other charts.
Reduce the size of a pane within a chart #
There are times when you want to have many indicators available but have insufficient vertical space to see all of them on the screen at the same time. You can work around this by adding the indicators to the chart and then using a CMD/CTRL – double click on a chart pane to reduce it to the title only and allow the other chart panes to increase in size. Use the CMD/CTRL – double click to restore the pane to normal size.
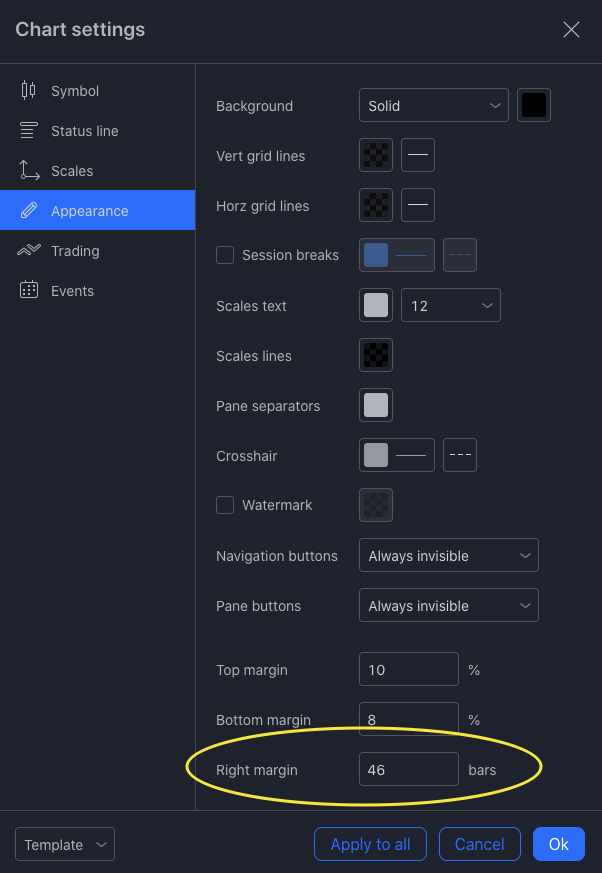
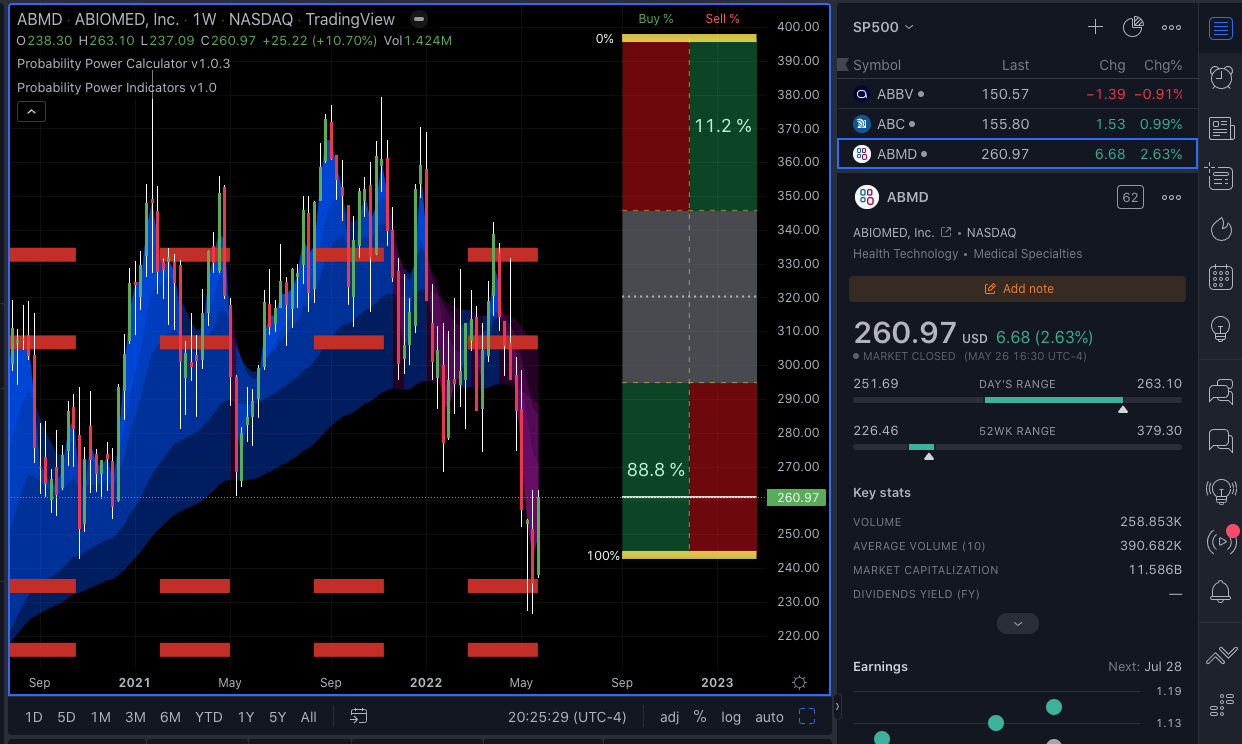
Reducing scrolling with Probability Power Calculators #
The Probability Power Calculators are drawn the right of the current price bar. By default, Trading view will attempt to draw the chart so that the current price bar is offset the equivalent to 4 bars from the last price bar. To prevent needless scrolling to bring the Probability Power Calculators into view, set the chart setting’s default right margin sufficiently wide enough to encompass the calculator(s). This is easily done by having a chart with either one or both Probability Power Calculator(s) on the screen and simply increasing the right margin until the calculator(s) are fully on the chart.
Indicator Time Outs and how to deal with them #
The Probability Power Indicators uses a large amount of data to perform their calculations. When Trading View’s servers are active, they may occasionally time out and a big red “!” will appear next to the indicator.
If you click on the exclamation point, it will tell you to remove and add the indicator again. While it works, it’s also the long way of dealing with this issue, as you can simply type in another timeframe… e.g. if you are currently on the 5 minute timeframe, type in 15, pause for a second and then type 5 again. This will usually clear up the issue without deleting the indicator and re-adding it to your chart and takes 5 seconds vs 30 seconds.
Scanning #
Certain strategies require you to search for stocks meeting a set criteria or conditions. While Trading View does have a scanner, it currently does not allow the usage of Pinescript – meaning that the scanner can’t be used to search for specific Probability Power Indicator values.
As a workaround, you can create a watchlist of symbols that have options, and a specific review chart layout of say a 1-week timeframe showing the Long-Term Probability Power Calculator, and then quickly scan through the watchlist symbols the market is closed. While you can do it during market hours, the response time of Trading Views servers is slower when the market is open.
It’s not unusual for me to quickly scan through a watchlist of 500 stocks or so in less than 2 hours early Sunday morning when no one is using Trading Views servers.
Using my preferred option stock watchlist, I simply select the first symbol on the watchlist and hit the space bar – which advances to the next ticker. With a pad of paper, and my left hand on the keyboard to hit the space bar, I can quickly get through this weekly task.
If 500 stocks is too much, one can always filter them using some criteria in the scanner before reviewing them.
Data Related #
Power Volume Indicator replacements #
“The Power Volume Indicator is tied to the US Markets. Is there a replacement for <XYZ> exchange?”
The Power Volume Indicator is a broad-based US Market specific indicator. The data used to calculate it, is typically not available for most foreign exchanges and we have not developed a replacement indicator that can be used.
Our best suggestion for a replacement is that you select a broad-based index from your market and generate a compare chart to determine if the individual stock is performing better or worse than the broad market.


