- # Indicator Access
- # Subscription Related Questions
- # Indicator Questions
- # What markets can I use this with?
- # Can I win every trade by using the Probability Power Indicators?
- # Are the Probability Power Indicators easy to use for beginners?
- # My Probability Calculator does not show percentage.
- # How do I update to the latest version of a Probability Power Indicator?
- # Are the Probability Power Indicators compatible with international markets?
- # How can I add Probability Power Indicators to my iPhone charts?
- # The long-term Probability Calculator does not "fit" or scale well on my 3-minute chart. How can this be adjusted?
- # My price candles are scrunched up with limited range line when I add the indicators. How can this be fixed?
- # Can I reverse engineer the tools?
- # Data Questions
This page contains a list of Frequently Asked Questions that we’ve answered in the past. The questions have been organized into categories that you’ll find to your right. It is quite likely that you’ll find your answer on this page.
If you can’t find the answer, we provide world-class 24/7 support via email, youTube, Twitter, and from within our Discord Group. Your questions will not go unanswered.
Indicator Access #
How do I get access to the indicators? #
Sign up for a trial subscription here – don’t forget to sign up for you Trading View account before you sign up! You can use our partner link to sign up.
After signing up, you can immediately connect your Trading View account to your subscription, or you can use the link in the subscription confirmation email to connect your Trading View account to your subscription.
How does this work? #
Once you purchase a plan for our all-inclusive membership, you receive an email with a link to get instant access to our premium suite of 3 powerful indicators directly on your Trading View account. It works on Trading View free plan; you don’t need to upgrade to use the indicators.
You also can get access to the VIP section of our Discord server from the link we email you where we provide automated trading signals, optimization, and a full community experience with lifetime updates to the tools you use.
I don’t have access to the indicators. #
Trading View’s technology uses the internet browsers to display the data. Often, the browsers will cache data that really needs to be updated. The list of indicators that you have access to is one such piece of data they might inappropriately cache.
To get around this, simply refresh your browser window – or reload if you are using the Trading View application. If this doesn’t fix the problem, please contact us at contact@powerindicators.com and make sure you include your Trading View username in the email body.
My Probability Power Calculator does not work #
The Probability Power Calculators are drawn to the right of the current price candle. If you cannot see the calculator after adding it to your chart, you may need to adjust your right margin to make the calculators visible. See the Trading View Advanced Tips for an easy way to adjust the margin permanently.
Subscription Related Questions #
How do I cancel my subscription? #
Simply login to the customer hub. Click subscriptions and select the subscription you want to cancel.
Can I reactivate a canceled subscription? #
It is not possible to reactivate a cancelled subscription. You would need to create a new subscription.
Can I pause my subscription? #
Yes this is possible via the customer hub. Simply login to the customer hub. Click subscription and select the subscription you want to pause and enter the date you want it to resume.
How do I change my subscription type? #
Currently it is not possible to downgrade or upgrade. Only option is to cancel the current subscription and create a new subscription. But is already being developed and hopefully completed by the last quarter of 2022.
How can I update my personal/billing info? #
See this Thrive cart support document for a detailed how to guide.
Is there a free trial? #
Yes, there is a 14-day free trial available for the Probability Power Indicators. You can combine this with the Trading View 30-day free trial to test the indicators and Trading View together.
Do you offer a money back guarantee? #
If you are not satisfied, we are not satisfied. We offer a 45-day no questions asked money-back guarantee
Indicator Questions #
What markets can I use this with? #
Probability Power Indicators works on any market internationally including stocks, indices, forex, futures, currencies, and commodities on all timeframes including 1m, 5m, 30m, 1H, 4H, 1D, 1W, etc.
You can utilize our toolkits for scalping, Day Trading, swing trading, or even for trading options as well. The tools we provide are fully customizable and can fit any style of discretionary trading.
Can I win every trade by using the Probability Power Indicators? #
Absolutely not. There is no magic solution or “algorithm” to give you the power to predict markets with a guaranteed percentage accuracy.
We provide simplified trading toolkits that are designed for discretionary trading, not to be followed blindly. Our tools can help you gain unique perspectives to use on any market available on Trading View. Tools are designed to help you make better decisions based on probabilities and avoid trading blindly.
Are the Probability Power Indicators easy to use for beginners? #
Yes, if you’re new to trading you can certainly use our tools with ease.
We have many easy-to-follow tutorials & guides for you to use as a beginner and get you started out on the right track.
My Probability Calculator does not show percentage. #
You need to enable them by turning on the settings dialog box. The settings dialog box is shown here and can be accessed by the gear icon to the right of the indicator status line.
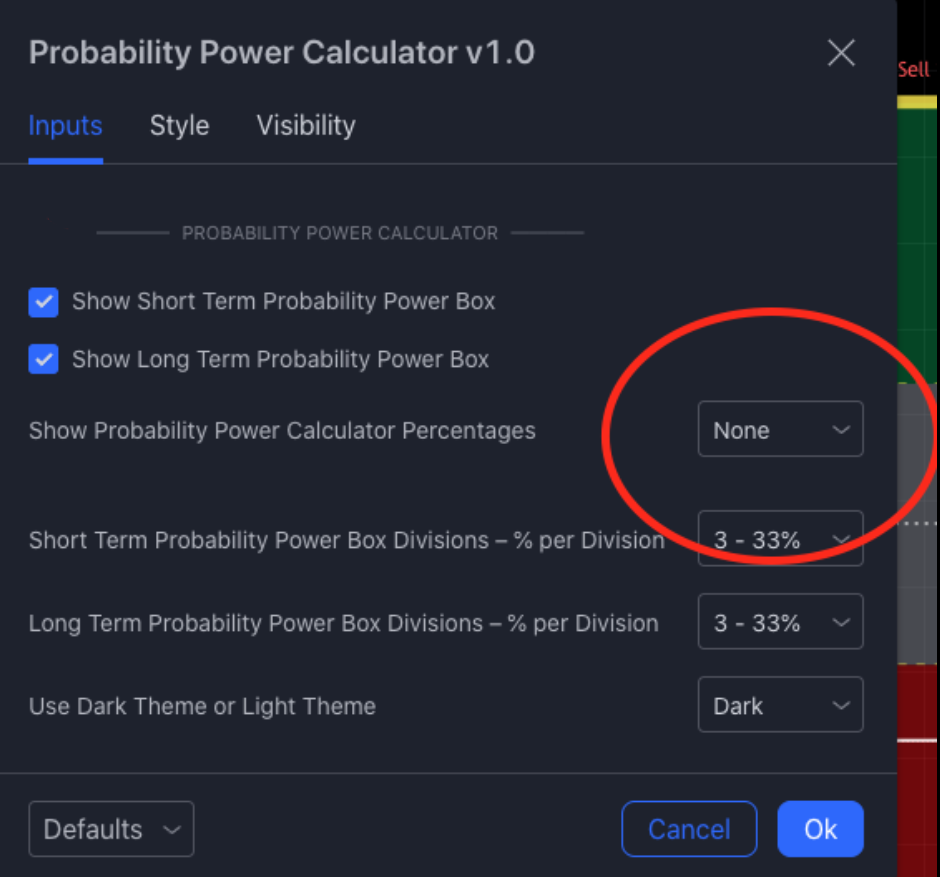
The drop-down menu circled will give you a choice between none, divisional percentages, or box percentages. Divisional being the 66%, 50/50, 33% percentages for each division assuming you stick with 3 divisions. Other division choices will give you different percentages. The box percentage will give you the percentage of the anticipated move remaining.
How do I update to the latest version of a Probability Power Indicator? #
You will need to remove and add back in the Probability Power indicator to your chart to get the update. You may need to refresh your browser window/app window to see the latest version in the indicator selection dialog box. For further information see this page.
Are the Probability Power Indicators compatible with international markets? #
Most of the Probability Power Indicators are compatible with international markets. The exception is the Power Volume Indicator, which relies on US Market data to give a broad US market directional overview.
How can I add Probability Power Indicators to my iPhone charts? #
To add them, start with a full chart window – not the quick chart window – and select the plus button at the bottom. In the resulting menu, select the indicators tile, and then the invite only option. This will give you access to the indicators. Given the number of steps, it is suggested that you make an indicator template, which will allow you to quickly add a “set” of indicators to your charts.
The long-term Probability Calculator does not “fit” or scale well on my 3-minute chart. How can this be adjusted? #
The long-term Probability Power Calculator is not intended to be used on intraday charts. Given that there are several orders of magnitude difference between a 3-minute chart and the 525,600 minute yearly chart, it is recommended that you switch to the short term Probability Power Calculator in the settings box for chart timeframes of Daily and intraday. The long-term probability box, however, does offer a data point on how you might structure or approach your trading strategy for that particular stock – e.g., when in the lower part of the yearly chart, you would consider looking for reversals rather than continuing to short the stock.
My price candles are scrunched up with limited range line when I add the indicators. How can this be fixed? #
It’s most likely that you do not have the “Scale Price Chart only” checked, and Trading View is scaling the chart based on the full price range of the indicators of which the price candles occupy a very small part. To fix, right click on the price axis, and make sure the “Scale Price Chart only” is checked.
Can I reverse engineer the tools? #
The Probability Power Indicators™ and Probability Calculator (patent pending), its trade secrets, as well as designs, upgrades, customization, and modifications provided to users OR PARTNERS affiliates shall remain at all times the property of DTZ GRP LLC dba Probability Power Indicators™.
In addition, in order to use the tools as a customer or partner affiliate, you agree not to reverse engineer, decompile, disassemble, or otherwise reduce to human perceivable form the any portions of the Probability Power Indicators™ and Power Probability Calculator (patent pending).
USERS AND PARTNERS AFFILIATES shall not, at any time – even following termination of this agreement – COPY THE ” LOOKS AND FEEL “, trade secrets or user interfaces OF ANY PORTION OF THE SOFTWARE and/or educational assets of DTZ GRP LLC.
Copyright registrations, trademarks and patent pending violations may results in legal suits to defend and be compensated for Intellectual Property violations.
Data Questions #
The prices on my Trading View chart don’t match my charting program. #
The most likely cause is that you are using the free data feeds which don’t always match the exchange data prices.
If you are charting cryptos, make sure that your exchanges match as each exchange has it’s own data feed and pricing that may not match other exchanges.
We have an entire page dedicated to data feeds and similar issues you might be experiencing in detail. Please review this page for further information.


